How do people arrive in our central cities? Is it changing as we start to invest in walking, cycling and public transport? ViaStrada ran the third annual ‘cordon count’, providing a snapshot of how people arrive at and travel through central Dunedin.
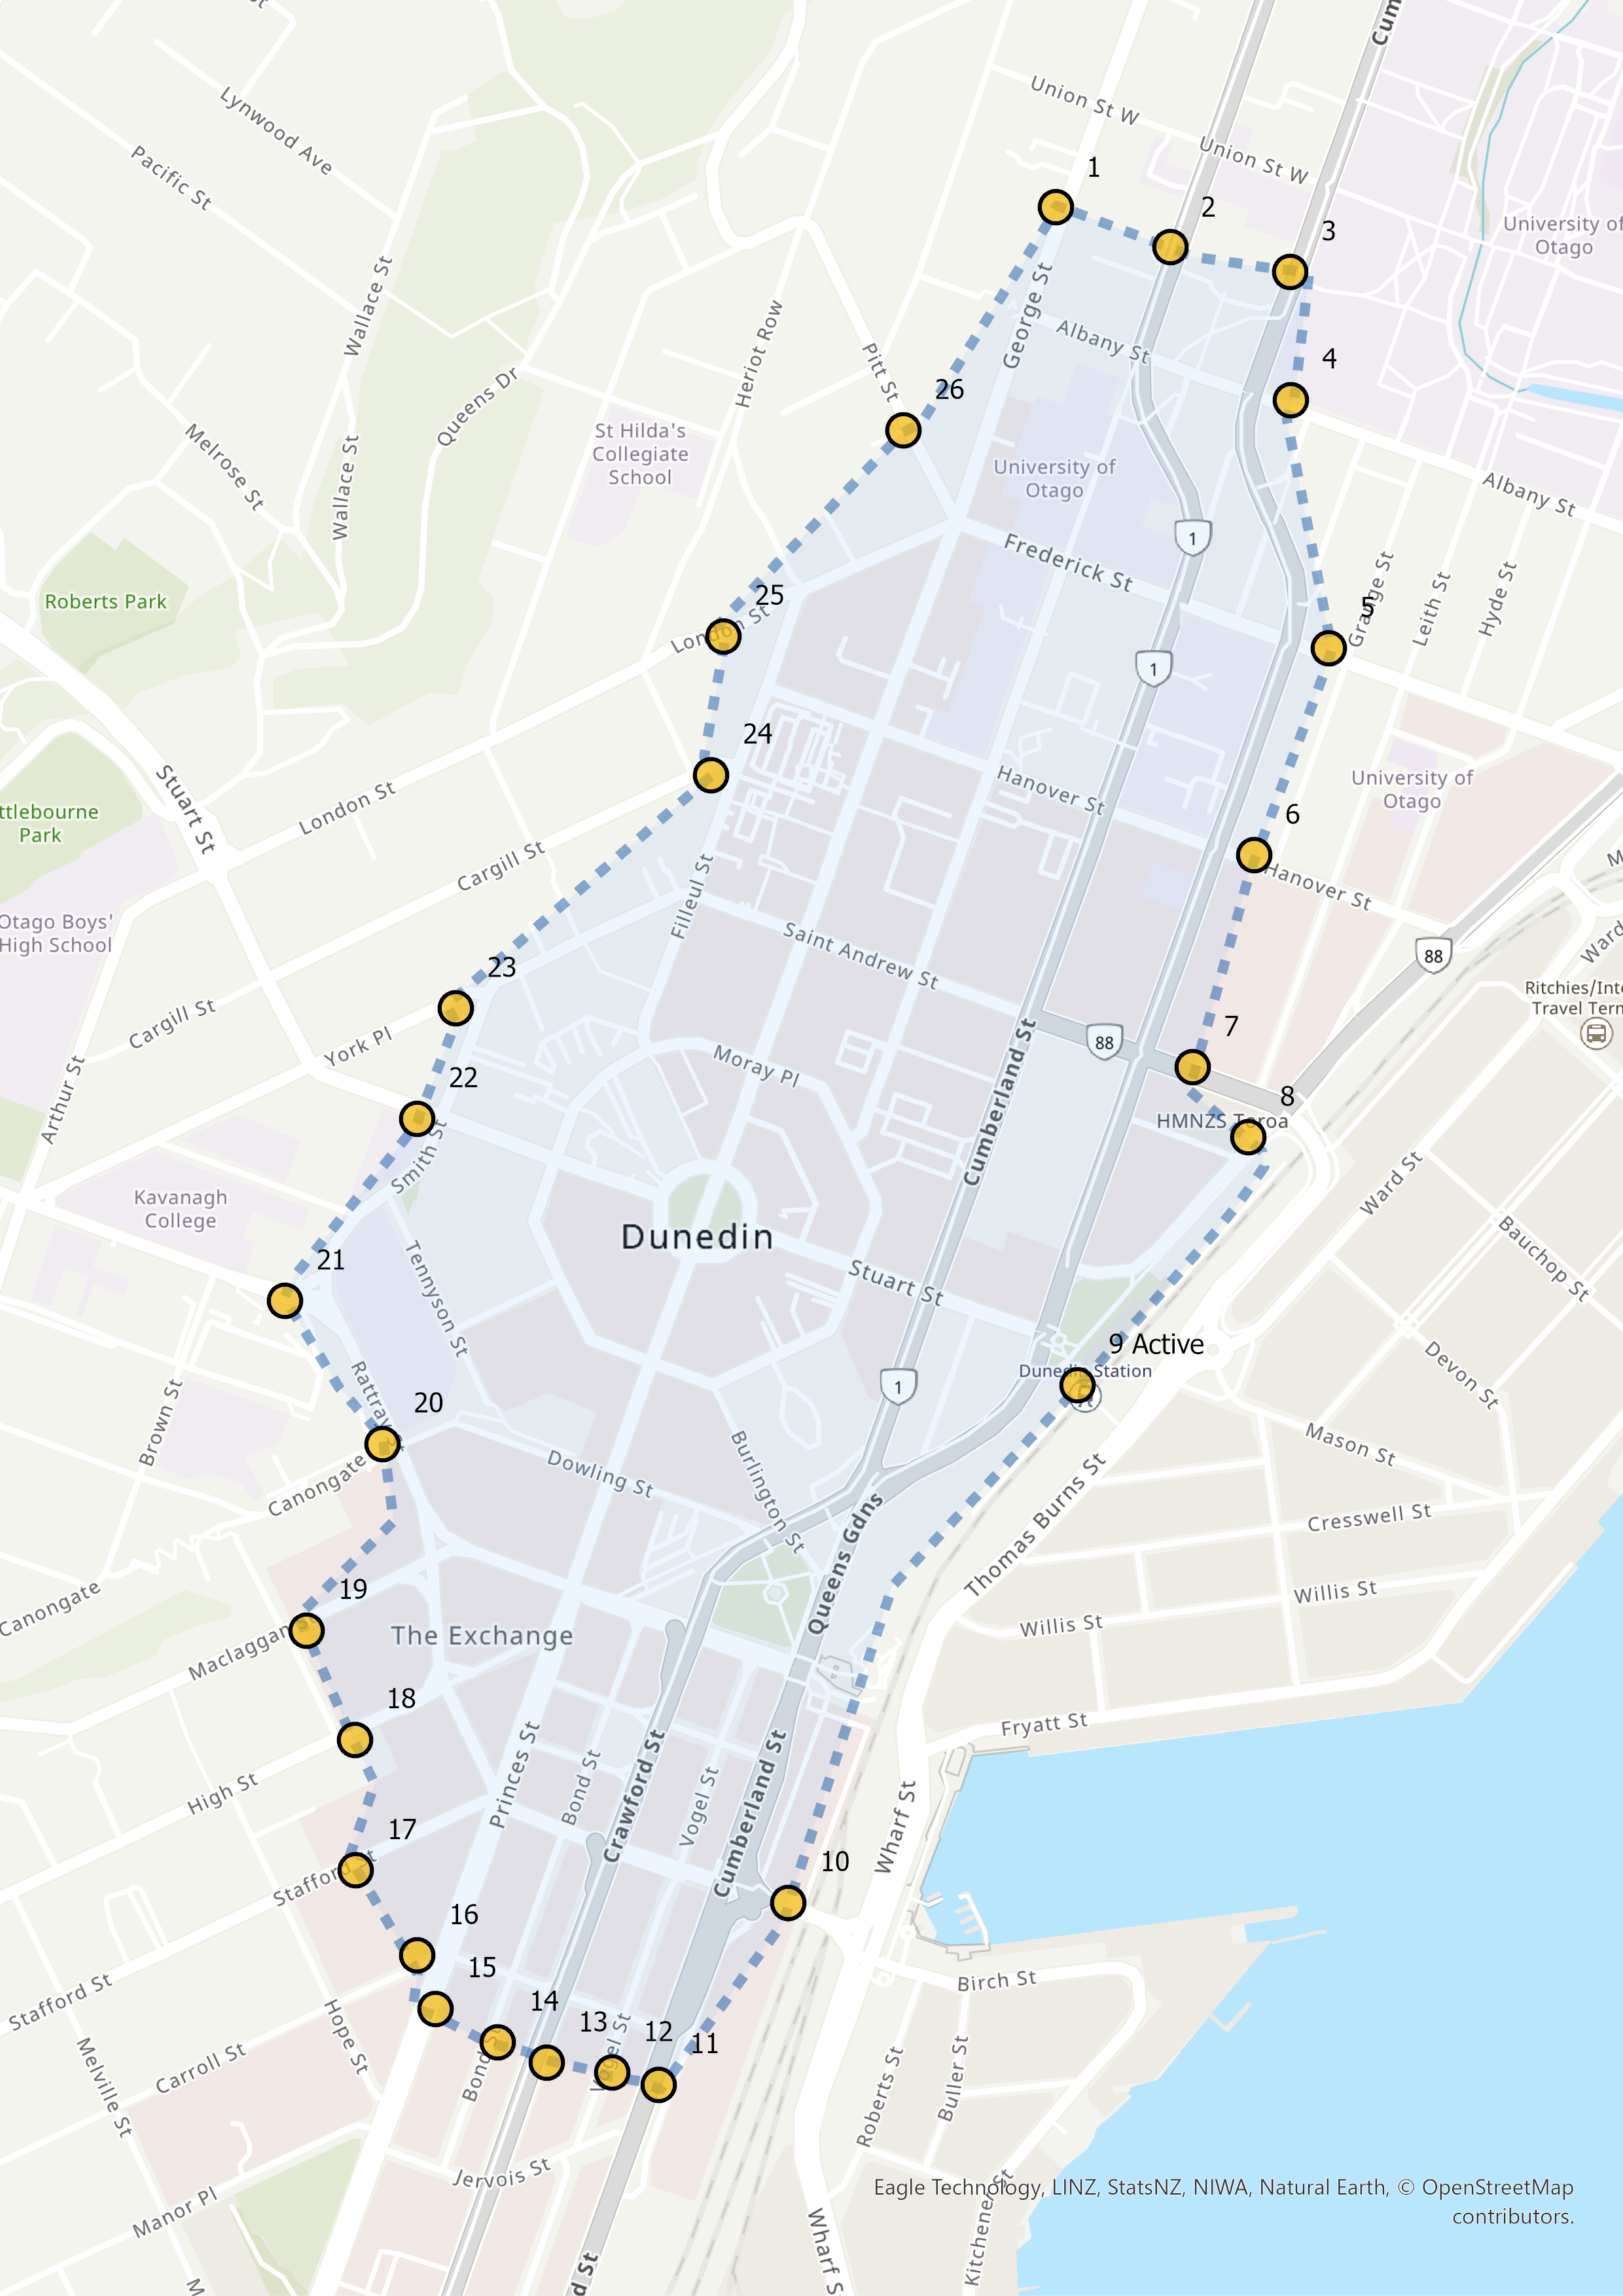
Dunedin City Council commissioned ViaStrada to develop, run and report on the 2022 iteration of the cordon count. “Cordon” refers to an imaginary boundary around the central city where surveyors were located at the most important entry/exit locations along this boundary. Surveyors were positioned at 26 sites around the central city to count the people and vehicles passing by. The cordon count ran in the morning peak (7:30-9:30 am) over two days: one for counting active modes and one for counting motor vehicular modes.
Methodology
In previous years, each movement into the cordon was counted by mode of travel in 15-minute increments. The location of people riding bicycles and e-scooters within the road corridor (road/cycle lane or footpath) was also counted. In 2022, ViaStrada redesigned the count forms and methods to also obtain:
• movements exiting the central city (to determine how many people are arriving and staying versus moving through)
• The occupancy of cars, buses, and trucks
• The gender of people walking and cycling
Findings
The number of people travelling into central Dunedin has decreased in 2022, compared to 2020 and 2021. This may be attributed to the effect of the ongoing Covid-19 pandemic affecting peoples’ travel choices (i.e. working from home and isolating). By number of entering movements, light vehicles were the predominant mode, followed by pedestrians, trucks, cyclists, and others. Pedestrians made up 15.3% of the entering movements (excluding commercial trucks), and 21.1% of the entering movements were ‘green modes’: people walking, biking, scootering, or taking the bus. When looking at the arrive and stay movements (entering minus exiting), 38.2% of these movements were ‘green modes’, and 61.3% were light vehicles.
With three years of data (2020-2022), the ability to understand trends in travel behaviour has continued to grow. With another few years of counting using the enhanced methods introduced this year and (hopefully) no pandemic to manage, it is expected that a fuller picture of travel patterns will emerge.