Predicting electric micro-mobility sales in NZ
In July 2017, the NZ Transport Agency published Research Report 621 (Regulations and safety for electric bicycles and other low-powered vehicles). As part of that, we predicted e-bike sales in New Zealand based on what had been happening up until 2016 in New Zealand and Europe. Four future scenarios were used for our predictions (low to extreme growth) and with subsequent years of data now available from Stats NZ (warning: the extraction of data is complex!), we thought we would have a look how actual data track against our predictions.
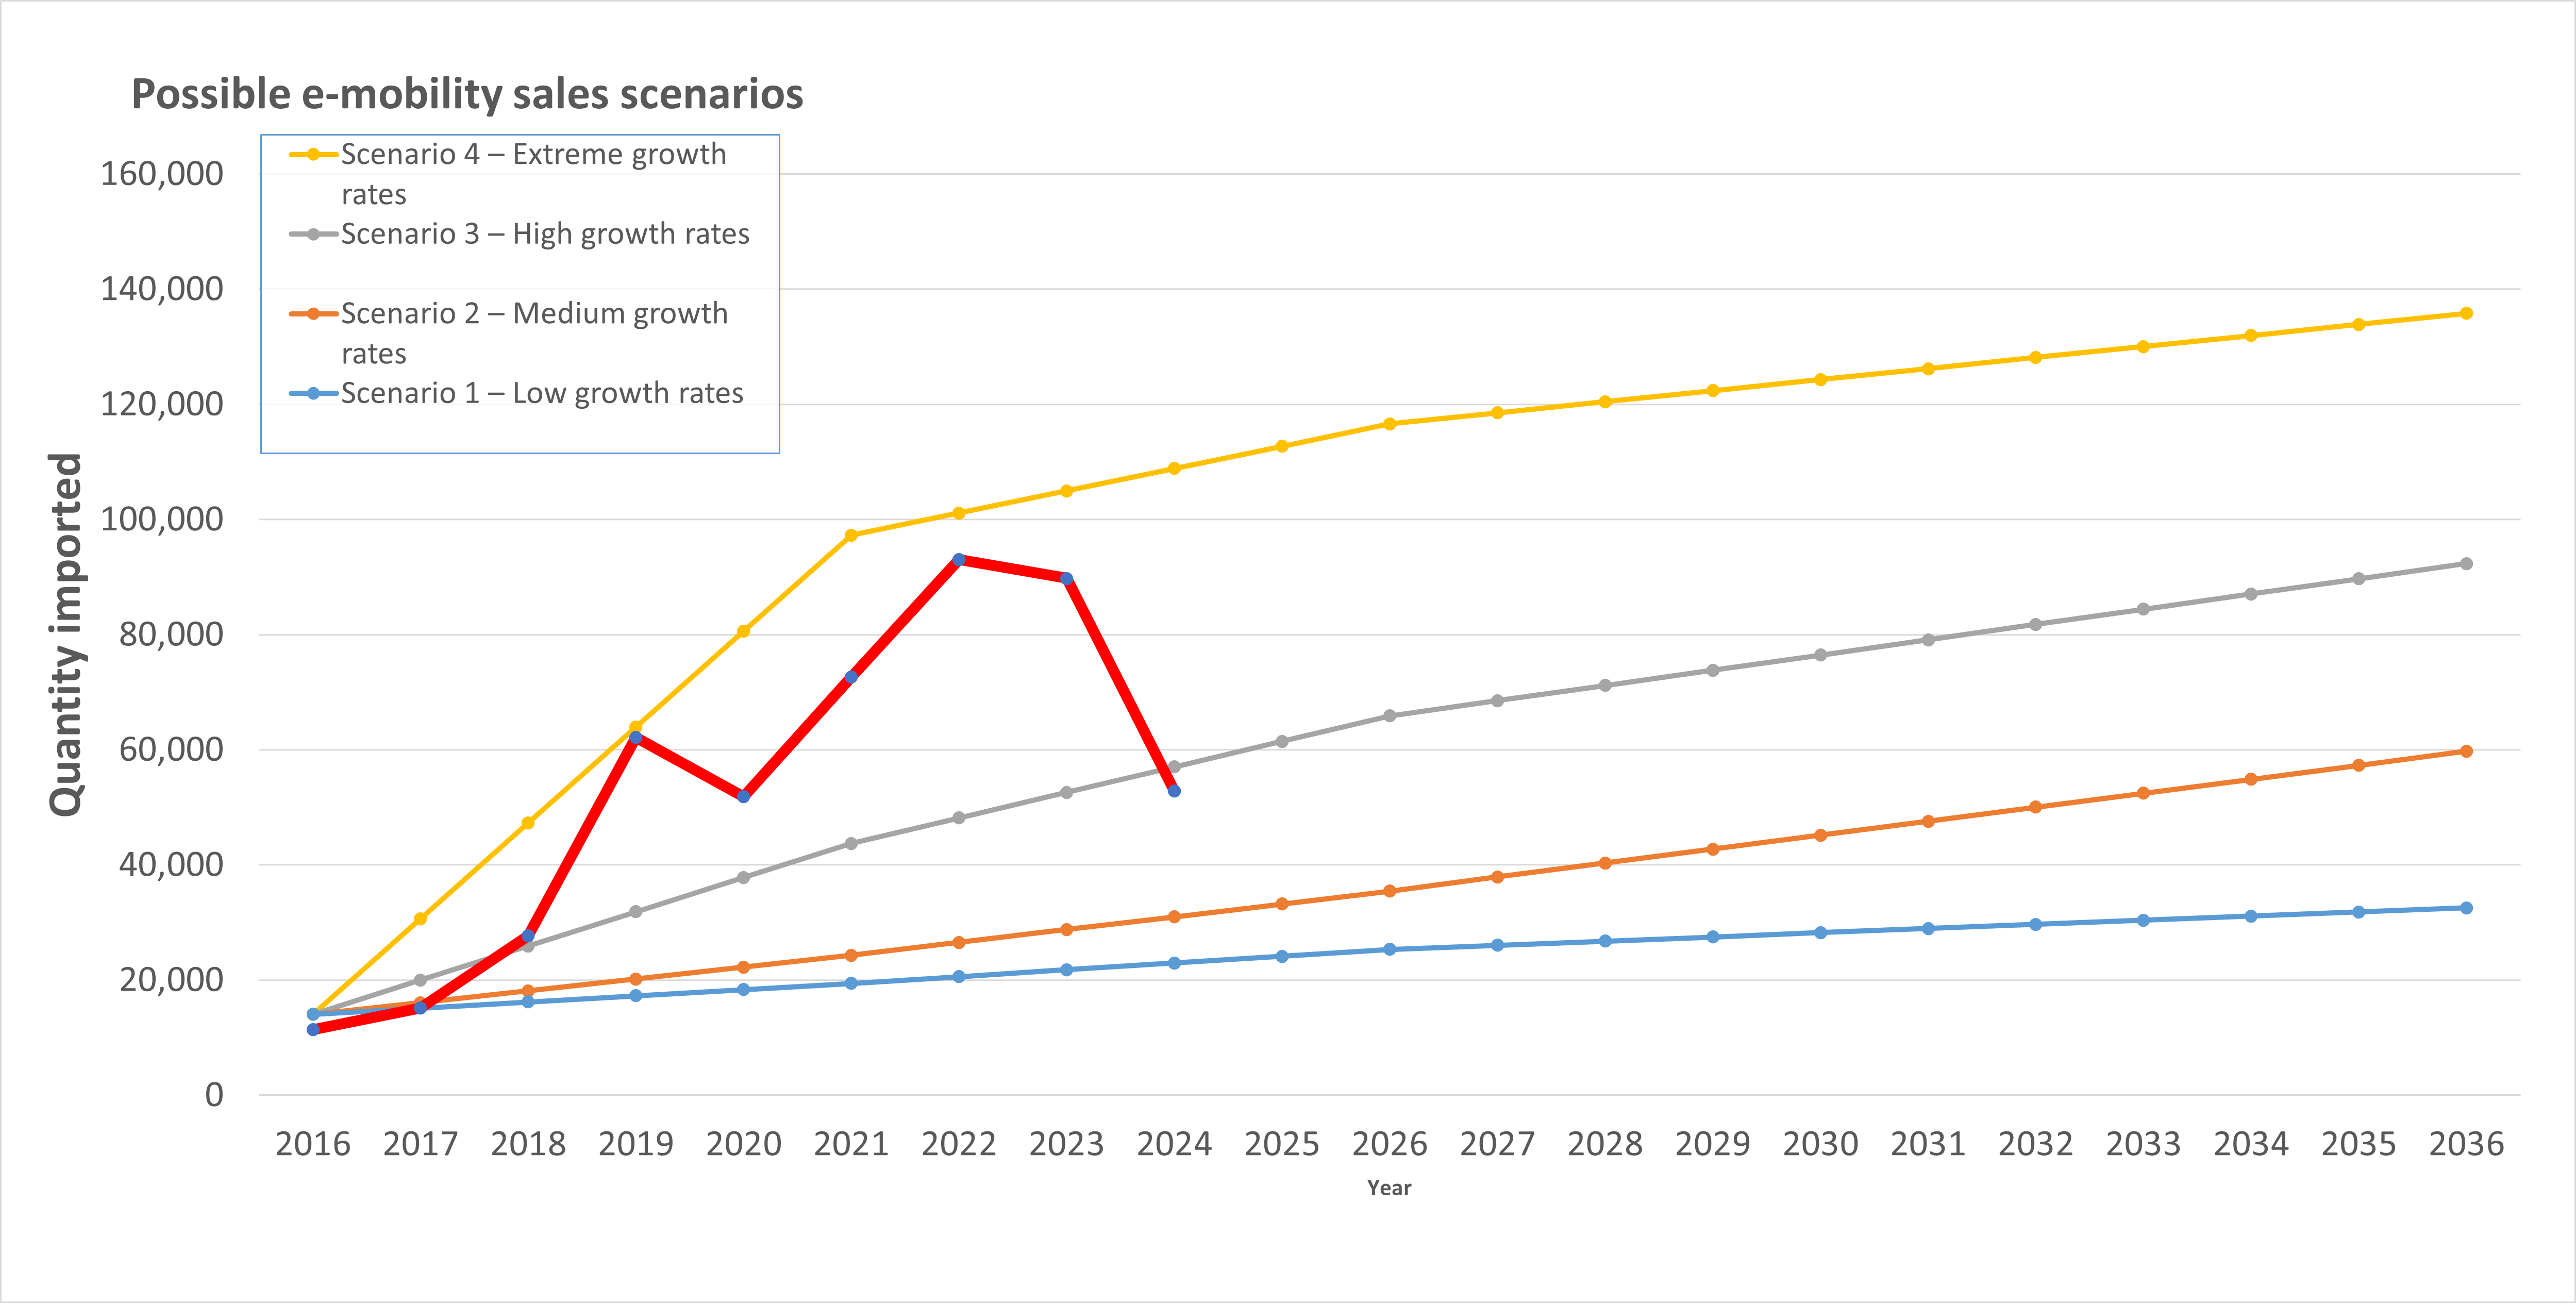
The graph shows actual data overlaid onto Figure 4.6 from the 2017 research report. There are a bunch of caveats. Customs NZ changed the classification codes in 2017 (see codes 8711.60 and 8711.90 of the tariff document) and it's somewhat murky what exactly gets counted. Customs has advised us that it is likely that e-scooters are being included, and make up about 40% of the sales. So e-bikes are probably tracking around the "High growth" line. At least, they were until the updated the data again in 2024. There's been a huge drop-off in demand, and we understand that wholesalers sit on a lot of stock. For the consumer, it means that now is a good time to snap up a bargain. And another observation is that the e-scooter boom appears to be over, and what gets sold is mostly e-bikes now.
Another way to try to gauge the growth of e-bikes is through observational surveys; we've done a few and a final report on speed, gender, and device types was published in March 2022. The difference over time in unassisted versus e-bikes is pronounced and reflects the above graph. Note that Covid-19 caused supply chain problems for e-bikes, which restricted the supply of e-bikes to the New Zealand market. During 2020/2021, demand exceeded supply.